4A. Discussion
- Formative Assessments Within Context
The first topic that must be addressed when discussing data is the need to look at all data within its context. This is particularly important when reviewing formative assessment creation and results. While it is true that students' socio-economic status, school and home environment and a million other variations play into any piece of data, the goal is to provide enough, small, authentic formative assessments, clearly linked to explicit goals and objectives so as to clearly identify patterns. Once those patterns emerge, data is a powerful tool to evaluate your own practice and students' growth.
Types of Formative Assessments
Often, data is defined as specific manifestations (i.e., state standardized tests, final exams, multiple-choice exams). However, it's imperative to widen the view of data to mean anything that can be measured; that is to say, everything. Standing with a roll book at the classroom door and meeting each student's eye as they walk in, saying hello and measuring their responsiveness (for example, a 1=very responsive, 2=moderately responsive and 3=not responsive) can give any teacher clear data by which you can tweak your day's lesson to attempt the highest level of learning. Other examples of data collection processes include:
- Using rubrics
- Students' self-assessments
- Warm-ups
- Exit Tickets/Slips
- Surveys, surveys, surveys
How to Evaluate Data
Regardless of whether the bulk of your data about your students is coming from summative or formative assessments, the evaluation of that data is always best done with others. One of the primary reasons for this is because it provides for multiple perspectives.
Richard and Rebecca DuFour have immensely helped promote the Professional Learning Community model, which many schools and districts currently use in their own iterations to improve school performance, however that is defined.
One of the characteristics of a Professional Learning Community model is the following:
A Focus on examining outcomes to improve student learning (DuFour, 2004; Feger & Arruda, 2008; Kruse, Louis, & Bryk, 1994; Louis, 2006). PLCs promote results-oriented thinking that is focused on continuous improvement and student learning (Reichstetter, 2006). The focus goes beyond a team getting together to look at data. In PLCs, teachers respond to data that require mutual accountability and changing classroom practices. Data help motivate teachers to see what is happening and what they need to do collectively (White & McIntosh, 2007).
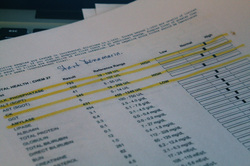
On a more practical level, it is very informative to evaluate data using an item analysis process. Many data programs used by schools, such as Edusoft or Achieve Data Director have pre-built Item Analysis Reports that can be created with minimal effort.
An item analysis report allows a teacher to review each item in an assessment, what the individual student actually answered, what the correct answer was and most importantly, what percentage of students answered which way. This allows the teacher to dig much more deeply into the simple "right or wrong" of an answer, but to actually start determining the validity of the question itself.
Richard and Rebecca DuFour have immensely helped promote the Professional Learning Community model, which many schools and districts currently use in their own iterations to improve school performance, however that is defined.
One of the characteristics of a Professional Learning Community model is the following:
A Focus on examining outcomes to improve student learning (DuFour, 2004; Feger & Arruda, 2008; Kruse, Louis, & Bryk, 1994; Louis, 2006). PLCs promote results-oriented thinking that is focused on continuous improvement and student learning (Reichstetter, 2006). The focus goes beyond a team getting together to look at data. In PLCs, teachers respond to data that require mutual accountability and changing classroom practices. Data help motivate teachers to see what is happening and what they need to do collectively (White & McIntosh, 2007).
On a more practical level, it is very informative to evaluate data using an item analysis process. Many data programs used by schools, such as Edusoft or Achieve Data Director have pre-built Item Analysis Reports that can be created with minimal effort.
An item analysis report allows a teacher to review each item in an assessment, what the individual student actually answered, what the correct answer was and most importantly, what percentage of students answered which way. This allows the teacher to dig much more deeply into the simple "right or wrong" of an answer, but to actually start determining the validity of the question itself.
|
Here are some other video tutorials on using data creation programs that your school may be using:
Edusoft Tutorials provided by a working, Edusoft-using educator (most videos are under 5 minutes) How to Create an Exam in Data Director Sharing an Exam in Data Director |
Data CreationThere are infinite ways to create data for your own use. One example was given above, about the teacher who stands at the door and assesses students' responsiveness as they come in the classroom each day.
Other ways to create data include using programs that your school may already be using. If your school isn't using one of these programs, then creating the data by hand is do-able, as well. For example, assume you are using rubrics to assign an essay, and that essay has both a content and a process grade (the content grade would be for the final content of the essay itself, while the process grade would be for the submission of the outlines, brainstorming, rough drafts, etc.) After all of the essays are submitted and graded, you can evaluate the process grades and determine how many students performed satisfactorily for their content grade and what the associated process grade for each student was. Reporting this data back to students can be useful in encouraging them to actively participate in the process of writing. Another quick and easy way to create data is through surveys. There are many survey options online, like SurveyMonkey. If your school has Google Apps for Education, or you are a Google user, you can create surveys for free, quickly and easily using Google Forms. Watch the videos to the left to see how you can create a survey, and then watch the video below that one to see how you can use Flubaroo to make that survey into a self-grading wonderland of data. |
Discussion
Discuss your own experience with data.
- How is data defined at your site?
- Why is data used?
- Is the use of data a top-down mandate, or something that the teachers are interested in pursuing and diving into?
- Is the use of data authentic at your site? What, if anything, could be done to improve the perception of data use, evaluation and creation?
